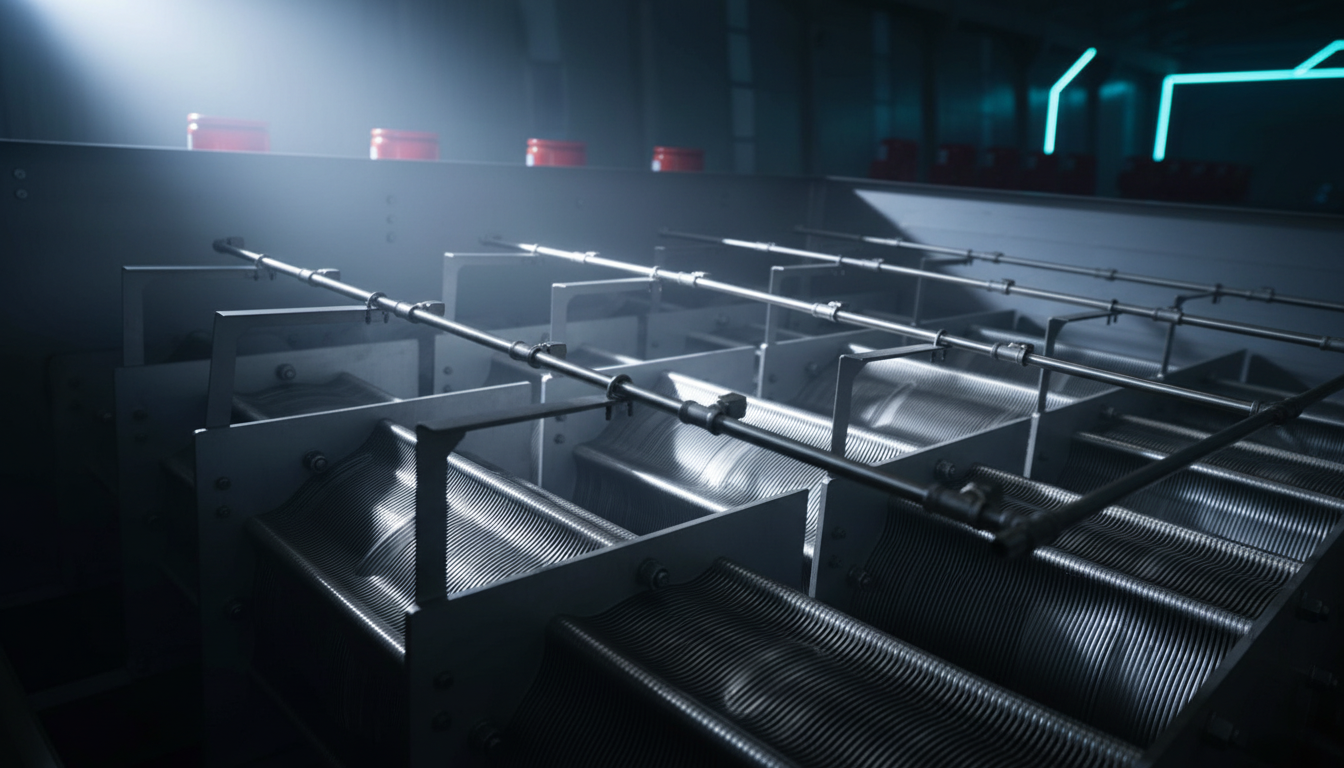
Dewatering filtrate often looks like a small side stream, but it can behave like a concentrated internal recycle that re-loads the biology. If the return line is uncontrolled, the plant ends up removing the same pollution twice, while aeration, nutrient removal, and clarification stability all suffer.
The practical question is not whether filtrate contains load, but how much, when, and in what form. Once you quantify that contribution, you can decide whether to smooth the return, isolate peak loads, or treat the stream separately.
Engineering Hub: get this sized for your plant
Describe your goal, effluent limit or sludge volume and receive a technology shortlist plus a sizing proposal – by email, no phone call required.
Measuring the Internal Load Contribution
Start by sampling the filtrate as a distinct stream, not as part of the mixed plant influent. Measure COD, ammonia, TSS, and, where relevant, conductivity and alkalinity; then compare the filtrate concentration against the raw influent and the actual return flow rate.
A useful internal-load estimate is concentration multiplied by flow, expressed as kg/day. For example, a filtrate at 1,500–4,000 mg/L COD with 40–150 m3/day can add a meaningful daily COD burden, and ammonia in the 50–300 mg/L range can quickly distort nitrification capacity if the biological system is already tight.
Do not rely on one grab sample. Collect several samples across a dewatering cycle, because press loading, cake dryness, polymer dose, sludge age, and cleaning steps can change the filtrate strength. For screw-press and cloth-filter systems, the first filtrate fractions are often different from the later, steadier discharge.
Timing and Controlling Filtrate Return
The timing of return matters almost as much as the mass itself. Returning filtrate during peak hydraulic load, low dissolved oxygen, or low biomass activity can magnify shock effects, while returning it during off-peak periods or in smaller, buffered doses can reduce process instability.
Good control strategies include equalisation tanks, flow pacing, and weekday or shift-based return scheduling. If the plant has ammonia sensitivity, avoid sending high-strength filtrate during periods when aeration basins are already near oxygen transfer limits or when nitrification is temperature-stressed.
A simple rule is to watch the ratio of internal recycle load to daily influent load. When the filtrate adds more than about 5–15% of the incoming COD or a noticeable share of the ammonia load, operators should treat it as a process driver rather than a minor side stream.
When Separate Treatment Makes Sense
Separate filtrate treatment becomes attractive when the stream is too concentrated, too variable, or too disruptive for controlled return. This is often the case when the return load causes repeated ammonia spikes, degrades settling, increases aeration demand, or forces the biological stage to run with little resilience.
Options include sidestream nitrification-denitrification, dedicated stripping or chemical conditioning, or deeper solids separation before return. A cloth-filter or screw-press dewatering train can help reduce entrained fines and stabilise the filtrate quality, but it will not eliminate the internal load by itself.
If the filtrate must be returned, make the return measurable and accountable. That means dedicated flow metering, routine composite sampling, and operator alarms when internal load increases faster than the biological stage can absorb.
[Internal Filtrate Load at a Glance]
- Label
- Value
- Typical filtrate COD
- 1,500–4,000 mg/L, depending on sludge type and dewatering method
- Typical filtrate ammonia
- 50–300 mg/L, with higher peaks after press start-up or cleaning
- Management target
- Keep internal recycle load visibly tracked in kg/day, not only in mg/L
| Indicator | What It Suggests | Typical Response |
|---|---|---|
| Rising ammonia in mixed liquor | Return load is exceeding nitrification capacity | Delay return, buffer stream, or reduce peak discharge |
| Higher aeration demand without influent change | Recycle COD is increasing oxygen consumption | Sample filtrate, verify mass load, review timing |
| More TSS in return line or clarifier upset | Fine solids are escaping dewatering | Check press performance, polymer dose, or cloth condition |
[Do Not Treat Filtrate as a Minor Side Stream]
If the filtrate is returned without measurement, the plant can unknowingly recycle a concentrated load into the front end. That often looks like poor biology, but the real issue is load timing and internal mass balance.
[Practical Control Checks]
- Measure filtrate COD, ammonia, and TSS on a regular schedule
- Convert concentrations into kg/day using actual return flow
- Compare peak return periods with aeration and nitrification performance
- Add buffering or scheduling before assuming the biology is failing
- Consider separate sidestream treatment if shocks recur or load share is high
How do we measure the internal load from dewatering filtrate?+
Sample the filtrate as a separate stream and measure COD, ammonia, TSS, and flow. Convert those results into mass load in kg/day so you can compare the return load directly with the plant influent and biological capacity.
When should filtrate be treated separately rather than returned to the plant inlet?+
Separate treatment makes sense when the filtrate is highly concentrated, highly variable, or repeatedly causes process upsets. If return timing, buffering, and operational control still cannot prevent ammonia spikes or oxygen stress, sidestream treatment is usually justified.
What monitoring indicators signal that the internal filtrate load is becoming a problem?+
Watch for rising mixed liquor ammonia, unexplained aeration demand, unstable clarifier performance, and increasing TSS in the return line. Another warning sign is when internal load becomes a large share of the daily incoming COD or nitrogen load.
Equipment we supply for this
Engineering Hub: get this sized for your plant
Describe your goal, effluent limit or sludge volume and receive a technology shortlist plus a sizing proposal – by email, no phone call required.